Monitoring and observability in Azure can quickly become a deep topic. Organisations may already rely on third-party tools that integrate well via API. And in most cases, those solutions are mature and entrenched.
But what happens when there isn’t a monitoring tool in place? Or when those existing tools don’t extend cleanly into Azure? That’s where the conversation often focuses to Azure-native monitoring — and can quickly expand from a 30-minute chat into several hours (or even days) of design work.
A common question I get in these scenarios: “What do we monitor?”
That’s where AMBA – Azure Monitor Baseline Alerts enters the conversation. AMBA can be a difficult concept to convey and reach a shared understanding – so I thought I’d give it a bash, along with general notes from my experiences.
Layered Strategy
Before diving into AMBA, it’s important to understand a typical layered Azure Native Monitoring Strategy. Each layer is foundational, and subsequent layers utilise and build ontop of the previous.
1. Telemetry Ingestion
Enabling the juicy raw data from in-scope monitoring resources – importantly, in a format that we can do something with.
Note! There are predominantly two types of telemetry that come from Azure resources. Metrics and Logs. Both are captured (and cost…) different, and will provide different functionality for alerting and visualing.
Platform Metrics are coming to us for free, and need to be scoped/focused to individual resources – think CPU/Memory for VMs or Transactions for Storage Accounts. We get this by default, and it’s stashed in our instance of Azure Monitor (a managed back-end if you will).
Note – The concept of Azure Monitor Workspace is relatively new. But they are isolated instances of Azure Monitor, with their own storage back-end. They’re predominantly used to ingest Prometheus metrics from AKS clusters at the moment (or anything with the Managed Prometheus Remote-Write) – but I can see this separation of Platform Metrics being something in the near future.
Logs come from some form of ingestion pipeline, and are saved into a Log Analytics Workspace. This costs, at a rate of ingested GB per month. The data (certainly performance related) is mostly the same as the Metrics coming into our Azure Monitor – but alerting and visualising Log data is much more enriched and featuresome.
A good monitoring strategy will take into consideration your Azure resource types in-use, and define an ingestion strategy for each (if needed). For example, Virtual Machines using the Azure Monitor Agent to enrich the monitoring capability with Log data – whilst your Storage Accounts are absolutely fine rocking with Platform Metrics.
2. Threshold Alerts
Define what “normal” looks like — and alert when it isn’t. This is where AMBA comes in.
3. Alert Actioning
Route alerts to the right teams, systems, or ITSM tools. Automate responses or generate tickets.
4. Visualisations
Dashboards to understand current state, trends, and relationships. Often Grafana or Workbook-based.
AMBA lives mainly at layer 2 – Threshold Alerts. It assumes telemetry is already available and helps you define baseline alert rules.
What is AMBA?
This is where the misconception kicks in. AMBA isn’t a “product”. You don’t install it, set it up once, and walk away.
It’s a framework – a community-backed library of telemetry signals and threshold recommendations for a wide range of Azure resources. Think of it like a cheat sheet: if you’ve got a VM, or a Key Vault, or an App Service – AMBA tells you what metrics to monitor, what thresholds to consider, and (this is the fun part) gives you the tooling to deploy alerts for them.
To save you a Google Search, see here – Welcome to AMBA! | Azure Monitor Baseline Alerts
It includes:
- Resource-specific metric and threshold recommendations
- Alert rule definitions
- Deployment options (manual, ARM, or at scale via Azure Policy)
Where to Start
What do you need? A question often met with mostly blank faces…
We’re building our strategy from the ground up – we’ve got our Telemetry coming into either Azure Monitor or a Log Analytics Workspace as Platform Metrics or Logs.
Now time to define Alert Thresholds. And we have a huge library of baseline thresholds for most of the Azure resources available to us within AMBA. We can go nuts, deploying direct from the AMBA website – either on an individual Alert basis (per resource) or at scale using Azure Policy (which stamps the Alert down on in-scope resources with a DINE Assignment).
If you want to deploy this stuff at scale, with structure, then what you really want is an AMBA Pattern.
And if you’re building/already have an Azure Platform aligned to the Cloud Adoption Framework (CAF) – the ALZ Pattern is your best friend.
AMBA Patterns (Scenarios)
Think of an AMBA Pattern as the deployment vehicle for AMBA. It takes the raw stuff from the library and wraps it in:
- Azure Policy Definitions
- Initiatives (to group those policies together)
- Assignment specifications (to actually deploy them)
- Parameterisation to configure things like severity, thresholds, and scopes
You could technically hand-roll this yourself, but the patterns give you a pre-baked baseline, saving hours of work – and a lot of potential YAML/JSON-related headaches.
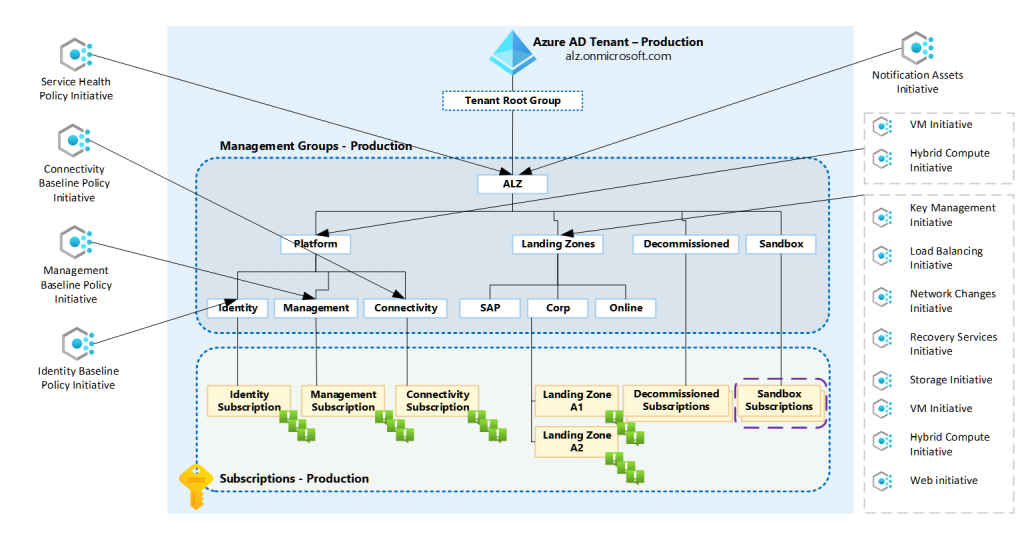
The ALZ Pattern is purpose-built to align with the Azure Landing Zone reference architecture. If you’re deploying workloads into a structured management group layout (e.g., Platform, Landing Zones, Connectivity, Identity, etc.), the ALZ Pattern maps perfectly.
You get:
- Modular initiatives broken down by resource type and/or Purpose.
- Policy definitions grouped logically (e.g., for Virtual Machines, Key Vaults, SQL DBs)
- Parameterisation to customise thresholds per alert
- Policy assignments designed to be applied to a Management Group hierarchy
You also get:
- The right log-based and metric-based alerts depending on the resource type
- Compatibility with decentralised alerting setups (where alerts live in the same subscription as the resource)
- Optional overrides via tags and remediation scripting to keep your environment clean
This stuff is deployed in a manner of different ways. Via a Portal Accelerator, CLI, PowerShell or with Terraform.
Now, if you go beyond the provided ALZ resources and want to extend things – say, for a resource type not included – it can get a bit manual.
You’ll likely need to:
- Write your own Policy Definitions (reusing the AMBA alert rules)
- Create your own Initiative and wire it up to your Management Group hierarchy
- Expose and manage parameters for alert thresholds
- Rename definitions for Terraform compatibility (e.g.,
Deploy_SQL_cpu_used_alert)
This is do-able (I’ve done it), but time-consuming, and prone to human error. That’s why a dynamic tooling layer – one that could build a custom initiative from selected resource types – would be a huge value add. Maybe one day…
Notes from the Field – Pt.1
The part 1 in the title suggests that, at some point, I will likely have further nuances to feed back on. This is an evolving product which used to sit outside of the CAF best practice for Platforms, but is slowly making it’s way into generalised documentation and practice.
- Policy Deploying is Great (Until It Isn’t)
Deploying alerts via Azure Policy is a genius strategy. You define scope, assign policies, and the alerts get created for everything in that scope – at scale. Done… Maybe…
All Policies are DINE (DeployIfNotExist), so please remember the potential delayed processing engine for subsequent DINE deployments. I’ve had organisations suggest the solution doesn’t work because they haven’t immediately got an Availability Metric Alert for their Storage Account upon creation.
Also – Let’s say you want to override a Metric threshold — maybe the threshold for the CPU of an App Service Plan at 80% is too noisy. You can tag the resource with an override, sure. But now the policy sees it as non-compliant. It’s up to you to then create the remediation task to remedy that Alert. Fine… but if your operations are decentralised, and remediation isn’t automated, this becomes a bit of a mess.
Field tip: Automate your remediation. AMBA even ships with example scripts. Use them. An Automation Account PowerShell script will take 20 minutes to set up and save a lot of headaches.
- Telemetry Must Exist First
This one catches people out.
AMBA assumes you’re already collecting the data it wants to alert on. If telemetry isn’t there, nothing gets deployed. No alert rules, no Grafana data, nothing.
Example: Virtual Machines. These rely on Log Search alert rules, which means you need to be ingesting performance counters via Diagnostic Settings into Log Analytics. If that’s not set up — you’re alerting on air.
It’s not a huge cost, but it is a cost. And a design consideration.
- AMBA Doesn’t Route Alerts
I’ve seen this assumption creep in.
AMBA defines what to alert on. And whilst it can deploy the routing of an Alert at scale – i.e. to an Email Address or Logic App – it doesn’t fully provide you with an Enterprise-Grade routing brain/engine.
Complex routing logic for alerts lives outside AMBA – but needs to be designed alongside it. The typical go-to is a Logic App to receive the alert trigger, and provide much better logic in the routing of that Alert – whether that be to an email address/SMS (Use Azure Communication Service!) or to ITSM integration via API.
- Visualisations are Nice – But Not Necessarily Free
The AMBA team provide some great Grafana dashboards that align with the metrics and thresholds. Super helpful.
But they use KQL, which means they expect the data to be in Log Analytics, even if the alert rule is metric-based. That often means:
- Enabling Diagnostic Settings to ingest the metrics
- Dealing with ingestion costs for visualisation purposes
Not a huge problem, but something to account for.
- Extending AMBA Beyond the Patterns – At Scale
I recently built out my own initiative for SQL DB alerting using AMBA definitions using the Terraform AMBA ALZ Module. Great result, but here’s the reality:
- Took over an hour
- Having to rename all policy files
- Constructed initiative JSON manually
- Created an assignment spec from scratch
- Had to expose and manage policy parameters
Would I do it again? Yes. Would I love a tool to automate it? Also yes.
This is where AMBA could evolve – a CLI or portal-based tool to build scoped policy packs from the base library. That would be a game-changer.
Final Thoughts
AMBA is not a product. It’s a building block in your Azure monitoring strategy.
Its strength lies in the fact that it brings guidance, standards, and governance to what is often a messy, ad hoc part of cloud management. And the AMBA Patterns – especially the ALZ one – make it ridiculously easy to deploy well-aligned alerting into structured environments.
But like most frameworks, its success depends on how well you implement and manage it. Layer it into your platform design. Automate the bits that get repetitive. Understand its boundaries.
I’ll be writing more about:
- AMBA alert routing via Logic Apps
- Terraforming custom AMBA Initiatives
- Extending Patterns for unsupported resources
- Real-world cost considerations when visualising via Log Analytics
Until then, happy thresholding.